Exercises for Week 2#
In compiler implementation, it is often desired to inspect the data structers we work with. A common scenario includes working with an AST that we either process or synthesize, where we want to understand its shape. The necessary device in this case is visualization of our data structures. Often times, visualization techniques we use are very rudimentary, yet it helps to be familiar with them, which is the purpose of this exercise.
We will explore two visualization approaches. In both cases, we will use the AST for arithmetic expressions from Assignment 01.
(* Defining the type for binary operations *)
type binop = Add | Sub | Mul | Div

(* Defining the type for arithmetic expressions *)
type expr
  = Int of int                       (* Integer constant *)
  | BinOp of binop * expr * expr     (* Binary operation *)
Formatting output to console#
Our first approach is to print the tree on console using indentation.
Write function print_tree that when called would produce the output
similar to Unix tree utility. For example, print_tree (BinOp (Add, Int 1, BinOp (Mul, Int 2, Int 3))) would generate the output
BinOp Add
├── Int 1
└── BinOp Mul
    ├── Int 2
    └── Int 3
Hint: if you are struggling with getting the ASCII connectives right, start with a simpler version that just uses the indentation
BinOp Add
    Int 1
    BinOp Mul
        Int 2
        Int 3
Formatting to graphviz#
Another popular way of visualizing intermediate representations is to
synthesize a .dot file to be used with Graphviz toolkit. Write a function
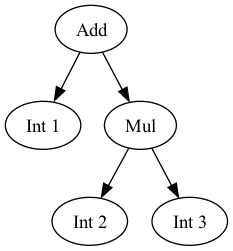
print_aexp_to_dot that generates a .dot formatted output corresponding to the input expression.
For example, for the expression above it can generate something like this
digraph AST {
  0 [label="Add"];
  1 [label="Int 1"];
  2 [label="Mul"];
  3 [label="Int 2"];
  4 [label="Int 3"];

  0 -> 1;
  0 -> 2;
  2 -> 3;
  2 -> 4;
}
Note that while the full spec of .dot format is quite extensive, it is sufficient to just the use the basic features, such as declaration of nodes and connectives, as in the example above.
If this output is saved to a file, e.g., aexp.dot we can invoke the dot command (which is available as part of graphviz package and should be already installed in the dev container) to get an image file, e.g.,
dot -Tpng aexp.dot -o aexp.png
will generate an image as follows